Property | Category | Description |
|---|---|---|
Active Project | User Information | The name of the current project. Read-only. |
Active Project Id | User Information | The ID of the current project. Read-only. |
Alpha | Channels | The alpha channel of a raster image. The alpha channel is transparent. You can make one of the three colour bands transparent. 1. Select the band from the list. For some images, these channel properties are inactive. |
Angle | Symbol | Override the angle of GML symbols. 1. Type a value in degrees. |
Blue | Channels | The blue channel of a raster image. For some images, these channel properties are inactive. If the properties are active, you can swap the colour order to display the image more clearly. The colour channel settings are saved to a file with the extension |
CARIS Paper Chart File | User Information | The name and path of the paper chart file. Read-only. |
Colour | Brush | Override the colour of the fill of GML areas. 1. Select from the colour picker. |
Colour | Pen | Override the colour of GML lines. 1. Select from the colour picker. |
Colour | Symbol | Override the colour of GML symbols. 1. Select from the colour picker. |
Colour Depth | General | The number of bits used to indicate the colour of a single pixel in a raster image. |
Colour Enabled | Display > Image > Shading | True: Draw the depth image in colours that indicate depth. False: Draw the depth image in greyscale. |
Colour File | General | The colour file used to display depths in a surface. 1. Select from the list. |
Colour Map | Display | The colours defined for the image. 1. Select from the list. |
Colour Range | Soundings Contours | Assign colours to soundings and contours according to depth range. A colour range can be saved as a file with the extension To create a new range: 1. Select <New> from the list. The Colour Range Editor is displayed. 2. Click Add. The Add Range dialog box is displayed Define the range using minimum and maximum values. Positive values represent depths and negative values represent drying heights. 3. Select a minimum value and a start colour. 4. Select a maximum value and an end colour 5. Click OK. The selected colours are displayed in the Colour Range Editor. The new range is displayed in the list and can be selected. The <Edit> item is added to the list. This lets you modify the active colour range. To use a range file that is not displayed in the list: 1. Select <Browse> from the list. A File Open dialog box is displayed. 2. Select the range file and click Open. |
Colour Type | General | The colour type of the image. This varies according to the file type. For some files, it will be read-only. For others, it will let you select between a colour map and a colour range. |
Comments | Creation | Comments from the original file. |
Coordinate System | General | The coordinate reference system of the file. 1. Click browse (...) to display a listing of the coordinate system details. |
Creation Date | Creation | The date and time the file was created. Read-only. |
Creation Software | Creation | The software used to create the file. Read-only. |
Creator | Creation | The user name of the creator of the file. Read-only. |
Data End Date | Creation | The end date and time of the data. |
Data Start Date | Creation | The start date and time of the data. |
depth (m) | Data slices | The water depth, in metres, to which the data applies. 1. Select from the list. |
Digit Font | Display > Digits | The font used to display sounding digits. You can set the font, style, and size. 1. Click browse (...) to display the Font dialog box. |
Display Title | Legend > Labels | True: Display a title for the legend. False: Do not display a title for the legend |
Draw Cells | Display | True: Draw borders around the depth cells of a surface. False: Do not draw borders around the depth cells. |
Draw Digits | Display > Digits | True: Draw the sounding digits along with or in place of the depth image. False: Do not draw the sounding digits. |
Draw Image | Display > Image | True: Draw an image to show the surface. False: Do not draw a surface image. If Draw Cells is True, the cells will be drawn. |
Draw Mode | Display | How soundings are drawn. 1. Select from: • Points • Digits |
Engineering Digits | Display > Digits | True: Draw the soundings in engineering format. Engineering sounding are in decimal format with the sounding centred on the decimal point. False: Draw the sounding in hydrographic format. Hydrographc soundings have the decimal values (minor digits) as subscripts. |
Engineering Precision | Display > Digits | The number of places after the decimal point in engineering soundings. 2. Type a value. |
Feature Code | Soundings | The feature code used to display soundings. These determine if the soundings are slanted or straight, use decimal points or subscripts, and so on. 1. Select from the list. |
Feature Count | General | Number of features in the file or layer. Read-only. |
Filter | Filter | True: Display only the depth values between the Min Val and Max Val. False: Display all depth values. |
Fractional Display | Soundings | True: Display sounding values in fractions. False: Display sounding values in decimals. |
Green | Channels | The green channel of a raster image. For some images, these channel properties are inactive. If the properties are active, you can swap the colour order to display the image more clearly. The colour channel settings are saved to a file with the extension |
Height | General | The height of the image. |
Image Transparency % | Display | Make the image transparent. 0% is solid, 100% is transparent. 1. Type a percentage. |
Include Name | Legend > Labels | True: Include the file name in the legend title. False: Do not include the file name in the legend title. |
Interval | Legend > Labels | The interval between markings on the legend. 1. Type a value. |
Label Colour | Legend > Labels | The colour of the legend label. 1. Select from the palette or click Custom Colour. |
Location | Legend | The location of the legend within the Display window. 1. Select from the list. |
Mask Colour | Display | True: Pixels of the selected colour will be masked or hidden in the display. False: All colours will be visible. To select a colour: 1. Choose Colour Selector from the list. 2. Click on a colour in the image. Previously selected colours will be displayed in the list. |
Mask Inclusive | Display | True: The selected colour and colours within the tolerance will be masked. False: All colours except the selected colour and colours within the tolerance will be masked. |
Mask Tolerance | Display | The percentage of colour variation from the mask colour that is allowed in the mask. A mask tolerance of 0 will hide only the exact colour selected. A larger tolerance will hide similar colours. 1. Type a tolerance value. |
Max Range | General | The maximum data value displayed. 1. Type a number. |
Max Val | Filter | Display only depth values below this value. 1. Type a value. |
Maximum Latitude | Extents | The latitude of one corner of the rectangular extent of the file. |
Maximum Longitude | Extents | The longitude of one corner of the rectangular extent of the file. |
Min Range | General | The minimum data value displayed. 1. Type a number. |
Min Val | Filter | Display only depth values above this value. 1. Type a value. |
Minimum Display Scale | Display > Digits | The minimum scale at which soundings will be displayed. 1. Type a scale denominator. |
Minimum Latitude | Extents | The latitude of one corner of the rectangular extent of the file. |
Minimum Longitude | Extents | The longitude of one corner of the rectangular extent of the file. |
Operation | Sources | The method used to create the file. |
Override | Brush | True: Override the default appearance of GML areas. See also Style, Colour, and Transparency. False: Use the default area style. |
Override | Pen | True: Override the default appearance of GML lines. See also Style, Colour, and Thickness. False: Use the default line style. |
Override | Symbol | True: Override the default appearance of GML symbols. See also Style, Size, Angle, and Colour. False: Use the default symbol style. |
Override Colour | General | Show features in a specific colour. True: The selected colour is used for the features on the layer. False: The colour from the file is used for the features. To select a colour: 1. Click the down arrow and select from the colour picker. |
Override Transparency | General | Make the features transparent. 1. Type a percentage. |
Path | General | The location of the file. Read-only. |
Pixel Normalization | Channel | Normalize the colour scaling of each channel in a raster image. Per Channel: Normalize and scale each channel individually. The min/max will be stretched to fix in the display range, usually 0-255. Global: Similar to Per Channel except that the min/max is calculated on all channels. All channels are then normalized and scaled using the same range. None: Colour is displayed as is. |
Platform Name | Creation | |
Point Size | Display > Points | The size of the points. 1. Type a value. |
Portrayal | General | The display method for the data. Portrayal methods include several IENC, INT1, and S-52 libraries. 1. Select from the list. |
Radius Map Scale | Display > Digits > Suppression > Radius | The map scale used for a sounding suppression radius if the radius units are mm at map scale. 1. Type a scale denominator. |
Radius Value | Display > Digits > Suppression > Radius | The minimum radius between soundings when the Suppression Type is Radius. 1. Type a value. |
Radius Value is | Display > Digits > Suppression > Radius | The units for the Radius Value. 1. Select from: • Metres on the ground • mm at map scale |
Red | Channels | The red channel of a raster image. For some images, these channel properties are inactive. If the properties are active, you can swap the colour order to display the image more clearly. The colour channel settings are saved to a file with the extension |
Resolution | General | Resolution of the image. Read-only. |
Reverse Colours | General | True: Reverse the order of the colours in the colour file. False: Use the colours in the given order. For example, the Rainbow colour file normally uses blue for deep and red for shallow. If Reverse Colour is true, red is deep and blue is shallow. |
Rounding | Soundings | The method used to round sounding values. 1. Select from the list. |
Shading Enabled | Display > Image >Shading | True: Smooth the depth cells to produce a smooth shaded image. False: Do not smooth the depth cells. |
Show Nodes | General | True: Display the nodes of all features. Line nodes are blue, text nodes are green, and point nodes are orange. False: Do not display the end nodes. |
Show Legend | Legend | True: Display a legend on the layer. False: Do not display a legend on the layer. |
Show Rejected Points | General | True: Display any rejected points in the file. False: Do not display rejected points. |
Size | Soundings | The size of the soundings in the display. Default is 1.45 millimetres. 1. Type a size. |
Size | Symbol | Override the default size of GML symbols. Size in is millimetres. 1. Type a value. |
Style | Brush | Override the default fill style for GML areas. 1. Select from the list. |
Style | Pen | Override the default style for GML lines. 1. Select from the list. |
Style | Symbol | Override the default appearance of GML symbols. 1. Select from the list. |
Sun Azimuth | Display > Image >Shading | Set the azimuth of the sun directly. 1. Type a value. The setting in Sun Position will change to match. |
Sun Elevation | Display > Image >Shading | Set the elevation of the sun directly. 1. Type a value. The setting in Sun Position will change to match. |
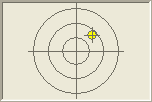
Sun Position | Display > Image >Shading | Set the position (azimuth and elevation) of the sun interactively. 1. Drag the sun icon in the target to a new location. The settings of Sun Azimuth and Sun Elevation will change to match. |
Suppression Type | Display > Digits > Suppression | Suppression involves hiding soundings to prevent overlapping in dense sets. 1. Select from: • Overplot Removal: The radius varies with sounding depth, since fewer soundings are needed in deep water. • Radius: The same radius is left around each sounding. See also Radius Value and Radius Value is. • None: All soundings are drawn. |
Surface Name | General | Path and file name of the surface. |
Symbolization Scale | General | The display scale for symbols and soundings. The default is Fixed, which means that symbols and soundings are drawn at a fixed size, even when zoomed in or out. 1. Select Fixed from the list or type a scale denominator. |
Thickness | Pen | Override the thickness of GML lines. 1. Type a value in millimetres. |
time (days since 1950-01-01 00:00:00 | Data slices | The time and date the data was collected, measured in days from 1950. 1. Select from list. |
Transparency | Brush | Override the transparency of GML areas. 1. Type a percentage value. |
Transparency | General | Make the image transparent. Select a percentage value from the list. |
Transparency % | Display > Image | Make the image transparent. 0% is solid, 100% is transparent. 1. Type a percentage. |
Transparency % | Display > Points | Make the points transparent. 0% is solid, 100% is transparent. 1. Type a percentage. |
Username | User Information | The name of the active user. Read-only. |
Vertical Coordinate System | General | The vertical coordinate system of the surface. A vertical coordinate system defines the origin of height data. 1. Select from the list. |
Vertical Exaggeration | Display > Image >Shading | Exaggerate the height or depth values of a surface to make the differences more obvious. 1. Type a value. |
Width | General | The width of the image. |