Two chart types can be created in Paper Chart Editor:
• Database charts: These charts are stored in a schema. Panels can be populated from the following sources:
• Source features in HPD. Any source layer can be used – a workspace layer, project layer or filtered layer. The certification status on source features must be set to Verified. Panels can be updated with new or modified source features.
This method provides a structured source-to-product workflow so that new or modified source features can be incorporated later into the chart.
• External features from S-57, HOB or CARIS files. Features from these files are imported into the database and given the certification status of Under Construction. These features have no link to a source database.
• Standalone charts: Charts are created from external S-57, HOB or CARIS files and saved with the .pcc extension. The chart file is independent of the database. Database charts can also be saved as standalone paper chart files in PCC file format.
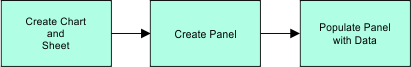
The basic workflow for creating database or standalone charts is shown below:
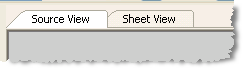
Sheet View
When a new database or standalone chart is created, a Sheet View tab is added to the Display window.
Sheet View displays the chart and associated panels. All editing and new features are added to the chart in Sheet View.
Workspaces and external files can also be displayed in Sheet View. |
Scale in Sheet View is calculated as a percentage instead of as a ratio as in other HPD editors. Scale can be changed either by zooming in or out of the view or by the Change Scale command.
Related commands:
• • • • • • | • • • • • • |