![]() CARIS HPD Paper Chart Editor
CARIS HPD Paper Chart Editor
![]() CARIS HPD Product Editor
CARIS HPD Product Editor
![]() CARIS HPD Source Editor
CARIS HPD Source Editor
![]() CARIS S-57 Composer
CARIS S-57 Composer
![]() CARIS Paper Chart Composer
CARIS Paper Chart Composer
Menu | Tools > Coverages > Grid > Interpolate Surface |
Tool |
|
This command is only available if the Bathymetry Compilation module is enabled. See Modules for further information |
Create a raster surface by interpolating a TIN or a variable resolution surface.
There are two interpolation algorithms to choose from:
• Linear: Uses a weighted sum of its natural neighbour's elevations to calculate the slopes of a surface. Depth is then computed based on the elevation on the slope at the location of each node. Two points are natural neighbours if their areas border one another. Linear interpolation has shorter processing times, but produces slightly coarser surfaces.
• Natural Neighbour: This method first calculates the slopes of a surface using the linear method, then applies an algorithm that determines the slope value for each specific data point in the dataset. This value is determined by calculating the effect of removing a point from the surface and then blending that data into the surface. The depth is computed using a weighted average of each point's expected neighbours and the trend of the slopes at these neighbours. Natural neighbour interpolation has longer processing times, but produces smoother surfaces.
Each cell in the surface is checked to determine if any original sounding values are present.
• If no original value is present, an interpolated value is used.
• If one or more original values are present, the shoalest value with true position is used.
You can select an uncertainty source attribute (for example, Std_Dev) to use for modelling the surface.
• If the Interpolate Uncertainty option is selected, any cells that contain interpolated values will also be displayed on the Uncertainty band with an interpolated value.
• If the Interpolate Uncertainty option is not selected, the Uncertainty band in the resulting surface will only display cells contained in the Depth band in the source dataset.
Related commands:
• | • |
Interface
Option | Description |
|---|---|
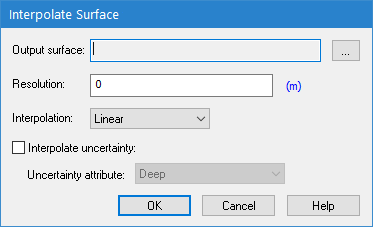
Output surface | The name and location for the resulting surface. |
Resolution | The resolution of the data in the output surface, This controls the spacing of the nodes in the surface Both a value and a unit of measure must be specified. The unit defaults to ground units. See the Units category under Display in Tools > Options. The precision of the resolution value must be within the precision defined in the Geographic Distance Along Axis option in the Coverage section of Tools > Options. If you enter a resolution value that is too precise, you will be prompted to enter a valid resolution. For example, the default value for Precision is 6. If you enter a resolution with more than 6 decimal places, the interpolation cannot be performed. 1. Type a value in the Resolution field. 2. Click the unit of measure hyperlink to select the desired units. The smaller the resolution value, the greater the disk space required for the surface. |
Interpolation | The type of interpolation to apply to the source data. |
Interpolate uncertainty | On: An uncertainty attribute is included in the interpolated data. The Uncertainty attribute option becomes available. Off: No uncertainty attribute is included in the interpolated data. |
Uncertainty attribute | The attribute from the source surface to be used as the uncertainty source. The list includes all bands in the source surface. |
Procedure
1. In the Layers window, select the TIN or variable resolution surface to be interpolated.
2. Select the Interpolate Surface command.
The Interpolate Surface dialog box is displayed.
3. Click browse (...) and define a name and location for the output surface.
4. Define the resolution for the output.
5. Select the interpolation method.
6. Define any other necessary options.
7. Click OK.
If you entered a resolution value that is significantly smaller than the mean edge length in the source dataset, a message like this is displayed.
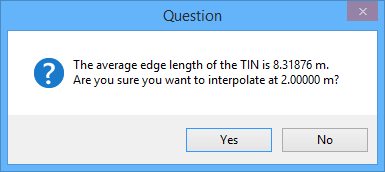
8. Do one of the following:
• To confirm the resolution value you typed is the one you want to use to interpolate the output surface, click Yes.
• To enter a new resolution value, click No and return to the Interpolate Surface dialog box.
A progress indicator is displayed on the left side of the status bar while the new surface is created. When finished, the surface is displayed in the Layers window. This surface will include an Interpolated band to represent the values from the original data source from which the TIN or variable resolution surface was created. If you chose the uncertainty option, an Uncertainty band is also included.