![]() CARIS HPD Paper Chart Editor
CARIS HPD Paper Chart Editor
![]() CARIS Paper Chart Composer
CARIS Paper Chart Composer
Menu | File > Export > Panel > PDF |
Export a panel to a Geospatial PDF file.
A specific area can be exported by using the Set Export Area command.
Related commands:
• • • • • | • • • • • |
Interface
Properties | Description |
|---|---|
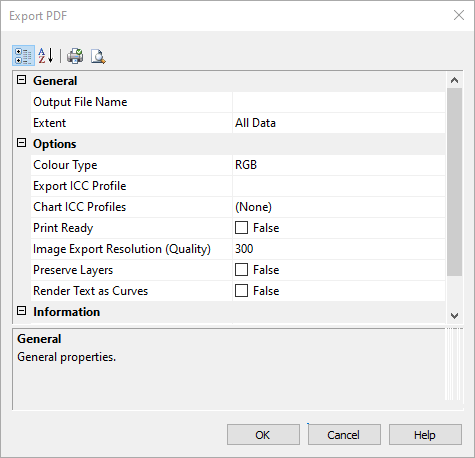
Output File Name | The name of the exported PDF file. 1. Click Browse to open the Save As dialog box. 2. Select a path and enter a name for the file. 3. Click Save. |
Extent | The area that is to be exported. Select All Data to export the entire panel or select Export Area if you set an area of the panel for export. |
Colour Type | Colour type for the panel. This option supports CMYK and RGB colour types. Select from the dropdown list. |
Export ICC Profile | Browse to an external ICC profile (.icc) to apply to the panel on export. When set, this option converts the colours to those of the ICC profile. |
Chart ICC Profiles | Select an ICC profile available in the chart to apply to the panel on export. Selecting any entry except sRGB fills the Export ICC Profile filename. Select from the dropdown list. The default is None. |
Print Ready | Set the handling of colours in the exported PDF: • True: If an Export ICC profile is specified, the colours are converted and no ICC profile is stored in the PDF export file. • False: If an Export ICC profile is specified, the colours are converted and the selected profile is stored in the PDF export file. If no Export ICC profile is specified, the profile(s) in the panel are used instead. Click the check box to change the value from False to True. |
Image Export Resolution | The DPI size for images that are exported with the panel. Type a value in the field. |
Preserve Layers | Export a panel to a PDF file that retains the same layer structure as in the application. Note: This option exports vector layers without dynamic masking only. Turn off raster layers or dynamically masked layers. Click the check box to change the value from False to True. |
Render text as curves | Print text as vector curves instead of as pixels. This option is useful if the chart contains fonts that are not on your printer or plotter. Note: This option is not available for raster charts or charts with a dynamic masking portrayal. Click the check box to change the value from False to True. |
Procedure
1. From the Layers window, select the Panel data layer.
2. Select the Export Panel to PDF command.
The Export PDF dialog box is displayed.
3. Set any necessary options.
4. Click OK.
A progress bar appears.
To cancel the export at any time, select the Esc key and confirm your action by clicking Yes in the pop-up window.