![]() CARIS HPD Paper Chart Editor
CARIS HPD Paper Chart Editor
![]() CARIS Paper Chart Composer
CARIS Paper Chart Composer
Menu | File > Export > Sheet > Spot Separates > PostScript |
Create separate PostScript files according to user-defined spot layer definitions and colour mappings.
All exported files are in PS-Adobe-3.0 EPSF-3.0 (encapsulated PostScript) format.
Spot colours can be saved to a Spot Colour Definition File. This file can be applied when creating other PostScript files.
Colours for which there is no direct match in the colour mapping file (e.g., ih_colour.xml) are mapped to an .rgb2cmyk file that is saved in the same location as the exported chart. This file contains colours from the chart from any external objects, such as images or text, that are added to the chart. You can use this mapping file to update the colour mapping file, if necessary.
If the chart contains images, those images should be monochrome, 8-bit TIFF images with a gradient palette. This command cannot be applied if an image exceeds 256 colours. JPEG images should be converted to TIFF, because JPEG images often contain more than 256 colours. |
Related commands:
• • • • • | • • • • |
Interface
Properties | Description |
|---|---|
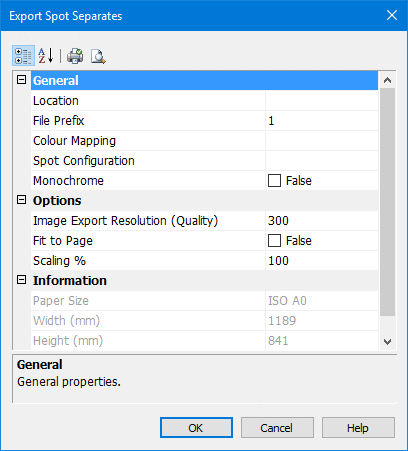
Location | Name and path for the PostScript files. Click Browse to select the name and location. You can also create a new folder for the files. |
File Prefix | Name for the PostScript files. The naming convention is in the following format: For example, the spot colour definition file contains four output layers: Colour1, Colour2, Colour3 and Colour4. The file prefix is MyChart. The following four PostScript files are created. MyChart_Colour1.ps MyChart_Colour2.ps MyChart_Colour3.ps MyChart_Colour4.ps Type a name for the file prefix. |
Resolution | This is the resolution for any raster images associated with the chart (not the chart itself) Type a value in the field. |
Fit to page | Fit the chart to the selected paper size. If this option is selected, the Scaling option is unavailable. Click the check box to switch the value from False to True. |
Scaling | Print the chart as percentage of its original size. Type a value. |
Colour Mapping | The RGB2TOKEN file is an XML file that defines specific RGB values to colour tokens. If no file is selected then one is created at export. The colour mapping file has a An existing colour mapping file can be used to map colours, if necessary. [Optional] Click Browse to select an existing file. |
Spot Configuration | The spot colour definition file defines the colour layers and respective colour tokens to be used for creating the PostScript files. Each layer in the spot definition file contains one or more colour tokens and is saved as a PostScript file. Spot colour definition files are created or edited in the Spot Colour Layer Setup dialog box. Click Browse to open to the Spot Colour Layer Setup dialog box. For more information, see Spot Colour Setup. |
Monochrome | Export to black and white files. Select the check box. |
Procedure
1. Select the Sheet layer.
2. Select the Export Sheet to PostScript Spot Separated PostScript command.
The Export Spot Separates dialog box is displayed.
3. Define any necessary properties and click OK.
A progress bar appears.
To cancel the export at any time, select the Esc key and confirm your action by clicking Yes in the pop-up window.