![]() CARIS HPD Paper Chart Editor
CARIS HPD Paper Chart Editor
![]() CARIS Paper Chart Composer
CARIS Paper Chart Composer
Menu | File > Export > TIFF |
Export a sheet, panel or Source View to a TIFF or GeoTIFF image.
GeoTIFF images can be exported by selecting the Geospatial option. Geospatial uses panel or sheet extents and coordinate settings to add geo-referencing information. If georeferencing cannot be applied, this option is not enabled.
GeoTIFF images can also be created by selecting the Sheet With Panel option. If a sheet contains multiple panels in different coordinate reference systems (CRS), then separate georeferenced images of the sheet are created with each image being referenced to a panel CRS.
For example, if a sheet contains two panels with UTM and Mercator coordinate systems, then two georeferenced images of the same sheet are created – one with a UTM CRS and another with a Mercator CRS.
A specific area can be exported by using the Set Export Area command.
Related commands
• • • • • | • • • • • |
Interface
Export Extents and Sheet With Panel are not available when exporting data from Source View. Ground Resolution is available only when exporting from Source View |
Properties | Description |
|---|---|
Output | |
Output File Name | Name and location of the output file. If Source View is visible, this field is empty; if a panel view or Sheet View is visible, the default location is Select a location and name for the file. |
Export Extents | The following options are available: • All Panels: Export all panels as separate images. A panel number is appended to the chart name (e.g. • Panel number: Export an area of the chart limited by panel extents. The export process computes an extent that encompasses all features that belong to the panel. That computed extent is not equal to the panel's boundary. • Sheet: • Export a single sheet as a TIFF image • Export separate GeoTIFF sheets set to the coordinate reference system of the panels. The total number of sheets are determined by the number of panels. This option is available only if the Sheet with Panel option is selected • Inked area of the sheet to export only those areas of the chart with content. • Current View: Export the area of Source or Sheet/Panel View that is currently in view. • Export Area: Export an area if an export area has been set. Select an option from the list. |
Sheet with Panel | Create a georeferenced image of a sheet based on the coordinate reference systems used in panels. This option is available only with the Sheet option in Export Extents. Select the Sheet with Panel check box. |
Geospatial | Use extent and coordinate reference system settings to add georeferencing to a TIFF image. Select the check box. |
Options | |
Ground Resolution | Size of one pixel on the ground in metres. This option is only available if exporting from Source View. Type a value in the field. |
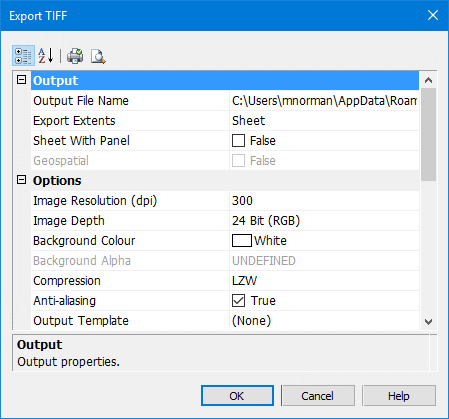
Image Resolution | Image resolution of the TIFF in Dots-Per-Inch (DPI). Type a value. |
Image Depth | Choose an Image Depth value for the number of colours to be used for the exported image file (8-bit, 24-bit or 32-bit colour range). |
Background Colour | Set a colour fill for areas of the sheet without data. Select a colour from the colour picker or create a custom colour from the palette. |
Background Alpha | The transparency value. This option is available only if 32-bit image depth is selected. Type a transparency value. |
Compression | Reduce the file size of the image by using a compression algorithm. Available options: • PACKBITS • LZW • NONE - Maintains the same file size. |
Anti-aliasing | To smooth the image and remove jagged edges, select the Anti-aliasing check box. |
Output Template | Templates control what layers and feature are exported to the TIFF chart. Select an existing template or select <Create and Manage> to create a new template. See Output Templates. |
Boundary | |
Enable | Create a boundary around the chart. Click the check box. |
Colour | Colour of the boundary line. Select a colour from the list or create a custom colour using the colour palette. |
Thickness | Thickness of the boundary line in millimetres. A value of 0 means that the line is one pixel wide. Type a value. |
Annotation | |
Enable | Include an annotation in the chart. Click the check box. |
Style | Font for the annotation. Select a font from the list. |
Text | Annotation text Type the text. |
Username | Add the Windows login name to the annotation. Select the check box |
Time Stamp | Add a time stamp of the export. The format is year-month-day hour:minute:second. Select the check box |
Justification | Justification for annotation. Select from the list. |
Position | Position of annotation with respect to the image. Select a position from the list. |
Offset | Offset of annotation from the edge of image in millimetres. Negative values move the text inside the map extent; positive values away from the map extent. Type a value. |
Indent | Indent (in millimetres) right- or left-justified annotation text from the origin. Type a value. |
Information | |
Width (Pixels) | Read-only width value is determined by resolution. |
Height (Pixels) | Read-only height value is determined by resolution. |
Procedure
1. Select a chart or source layer.
2. [Optional] Zoom into the area that you want to export.
3. Select the Export to TIFF command.
The Export TIFF dialog box is displayed.
4. Define any necessary properties and click OK.
A progress bar appears.
To cancel the export at any time, select the Esc key and confirm your action by clicking Yes in the pop-up window.